FlowPulse is a python package allows you to visualize your measures of flow as well as to run Monte Carlo Simulations based your data. It supports various datasources, from CSV files to Jira or Azure DevOps. While csv is the most flexible datasource, the connection to your Jira or Azure DevOps will allow you to run it continuously with the latest data. The true power of Flow Metrics and Forecasts comes when inspected on a regular base. The point of collecting data is to take action, so use this to make informed decisions about what you want to adjust! You can use this for free, we hope it helps you in your efforts to reach a better flow.
This tool is provided for free by LetPeopleWork. If you are curious about Flow Metrics, Kanban, #NoEstimates etc., feel free to reach out to us via Slack
Documentation Structure
The documentation is structured into various chapters. In Installation you can find information about how to get started with FlowPulse.
Under Configuration you’ll find everything you need to configure FlowPulse. This includes various ways of how to configure FlowPulse itself.
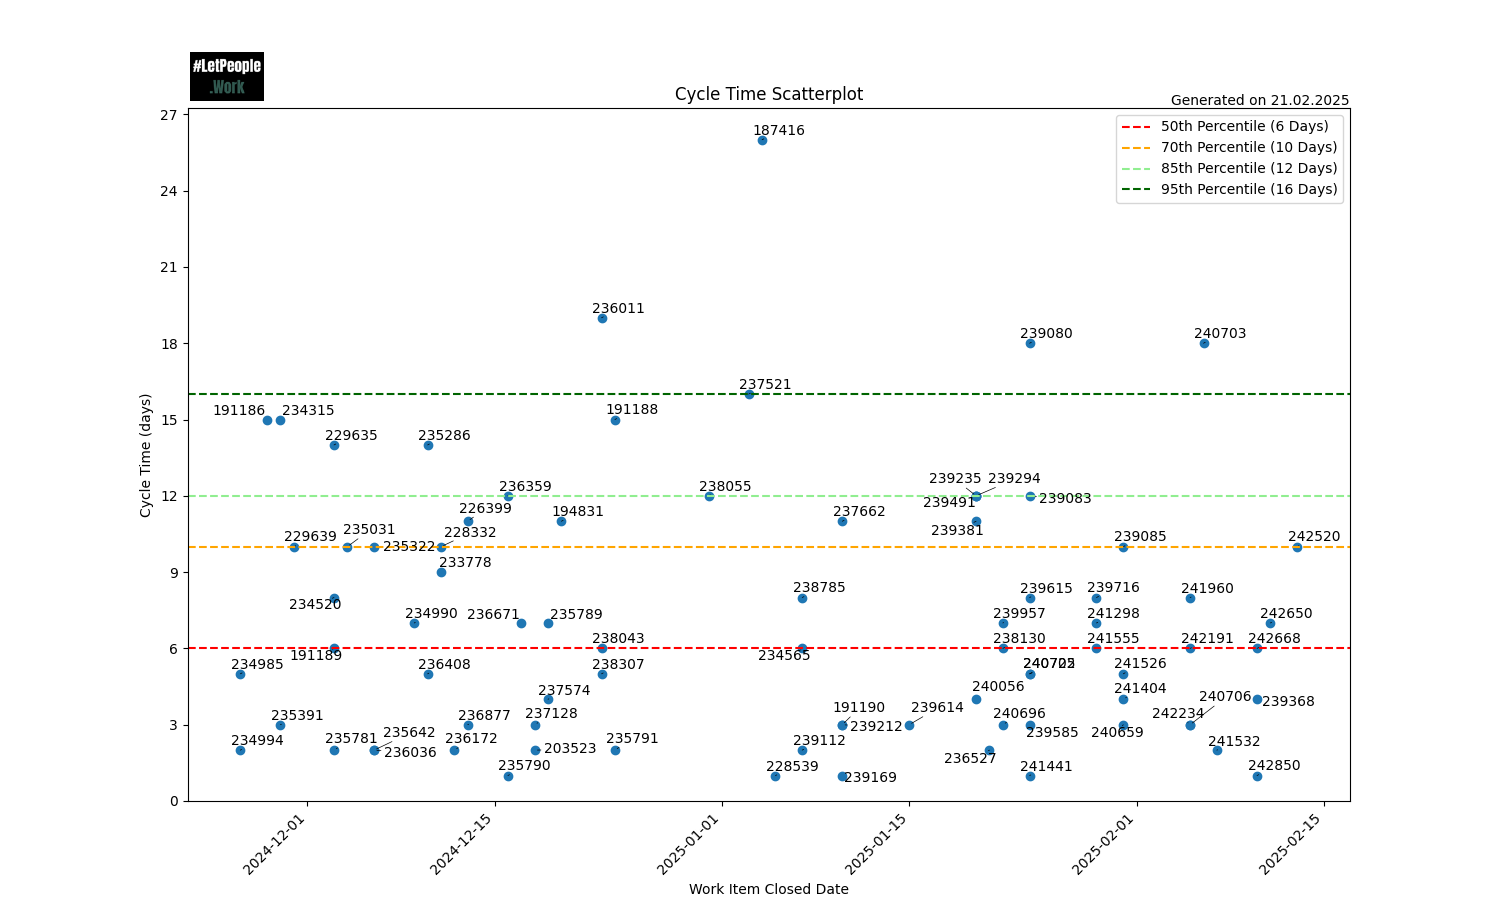
Data Sources explains from where (including Jira and Azure DevOps) you can load data, while Charts and Forecasts dive deeper into the respective Features.
Contributions & Questions
If you want to help us improve the documentation, please check out the options unde Contributions. If you have specific questions, it’s best to join our Slack Community.
Config Generator
You can use our Config Generator to help you get started with your first configuration.